Design evolution
Introduction
ColdStream displays the intermediate designs for running and finished cases of type 'Standard design' and 'Custom design' under the 'Design evolution'-tab. Opening this tab for a case of interest visualizes the progress of the optimization. At any given moment, you'll be able to see how many iterations have been performed by ColdStream. This information enhances the user's ability to track design progression over time, offering better visibility into how the design evolves in relation to set objectives and constraints.
The following chapter will delve deeper into the information displayed in the 'Design evolution'-tab. The last chapter will explain how to view the information for a specific iteration.
Design evolution tab
There are two types of graphical representations present in the 'Design evolution'-tab:
- An overall design performance graph is displayed at the top of the page.
- Target-specific graphs: for each of the targets, a separate graph displays their evolution at the bottom of the page.
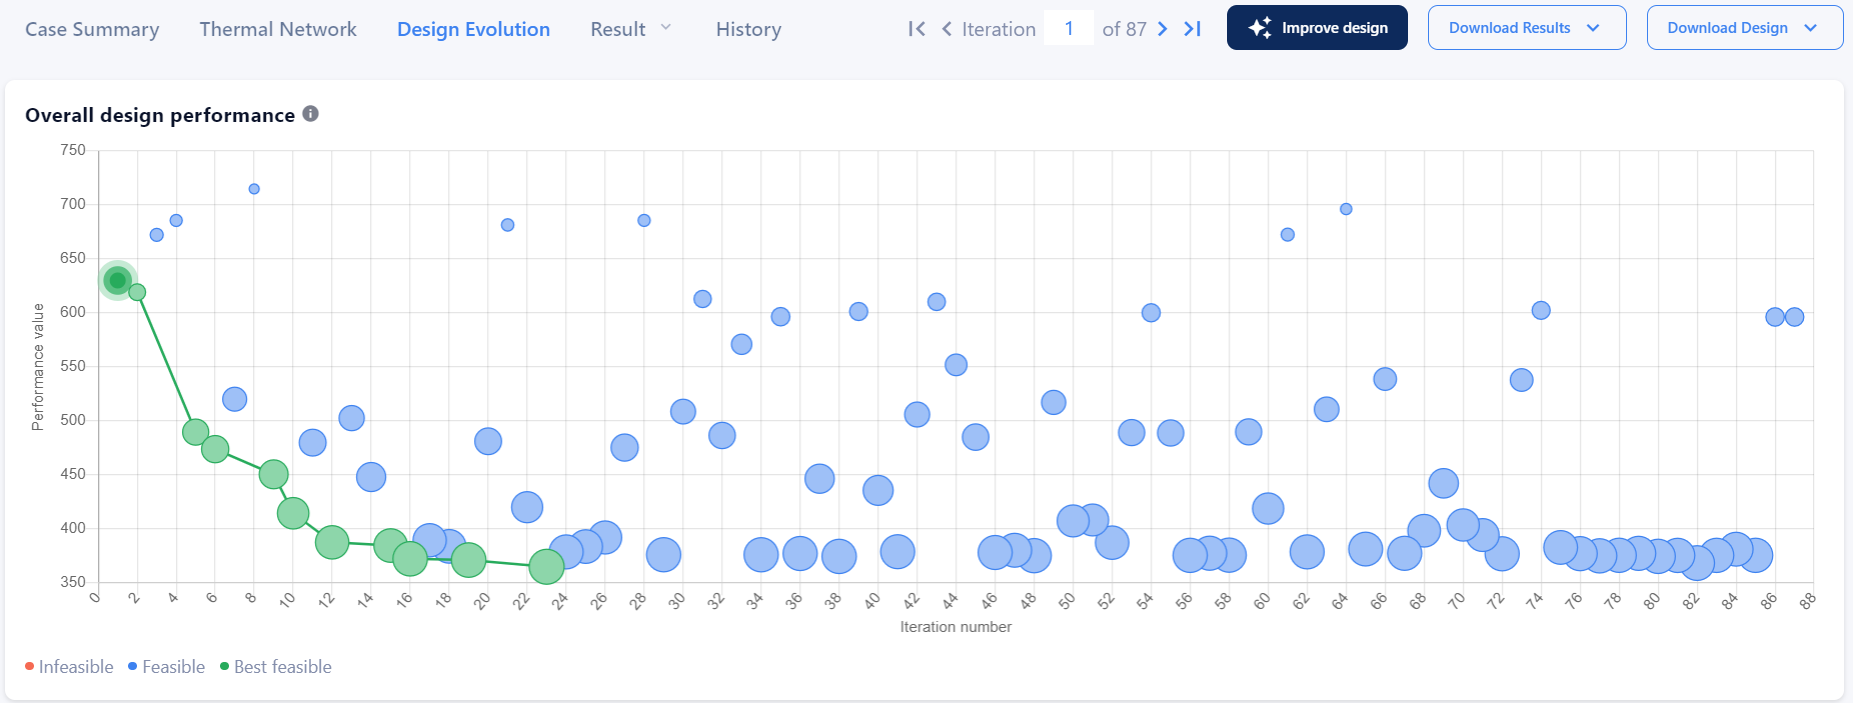
The first graph visualizes the overall performance evolution of the optimization across several iterations. The overall performance of the design is measured for the objectives of the case. Seeing as ColdStream performs an optimization, the lower this value, the better the performance. The different colors represent the feasibility of the design:
- Green: best feasible iteration up until now
- Blue: feasible iteration but didn't improve on last green design
- Red: infeasible iteration due to constraints not being met
Overall design performance graph
The target-specific graphs showcase the same information but for each target individually. Comparing these graphs with one another reveals which target dominates over the other. The legend is the same as enumerated above.
How to interpret the intermediate iteration data
The intermediate iteration data is presented at key stages throughout the design process. These data points act as snapshots of the design at various stages, enabling users to monitor progress and assess how well the design aligns with its objectives.
Key points to remember:
- The intermediate data points on the graph reflect the design's current state and its alignment with predefined objectives and constraints.
- Unlike full iteration results, intermediate iteration data may exclude detailed geometry and additional parameters present in later iterations.
- These data points are primarily for tracking progress and may not represent the complete set of design parameters at each stage.
The inclusion of intermediate iteration data aims to enhance the user experience by providing insights into the design's evolution, allowing users to make more informed decisions throughout the design process.
How to visualize the intermediate iteration data
Performance value - In the performance value scatter plot, each intermediate iteration is represented by a datapoint as shown below. This is analogous to the datapoints associated with iterations that include results.
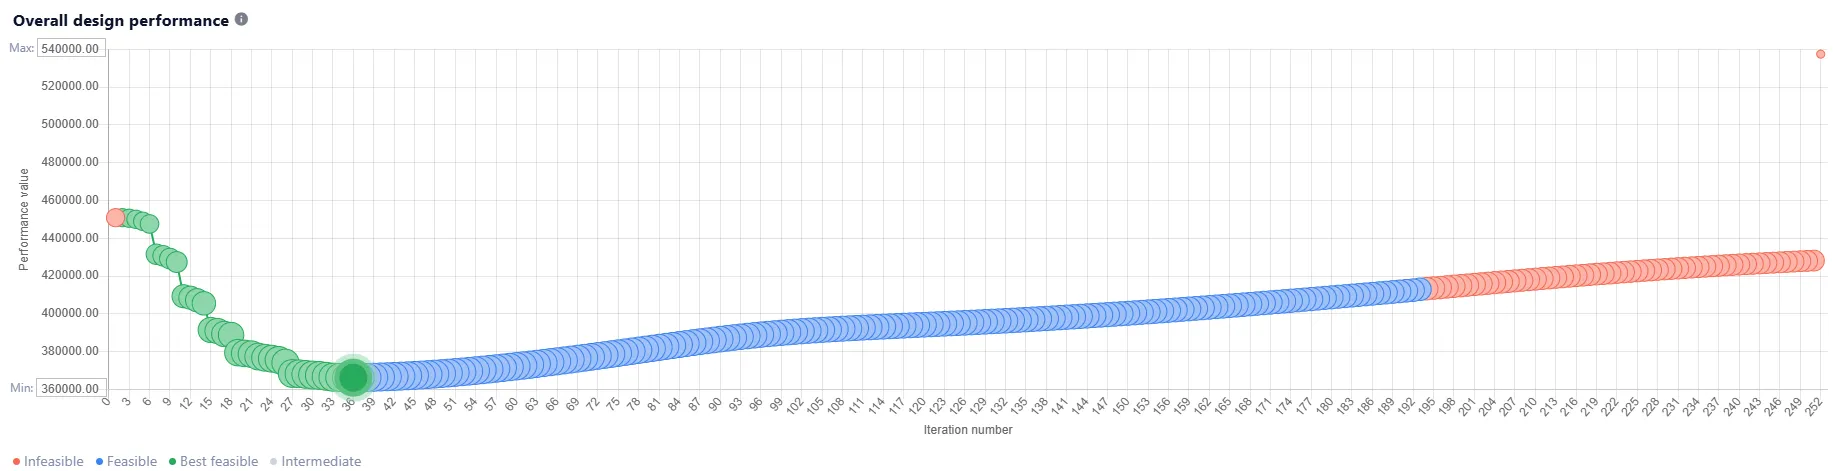
Overall design performance graph with intermediate iteration data
Targets
The objectives and constraints applied during optimization are updated for each intermediate iteration, with a corresponding datapoint displayed on the target value graph.
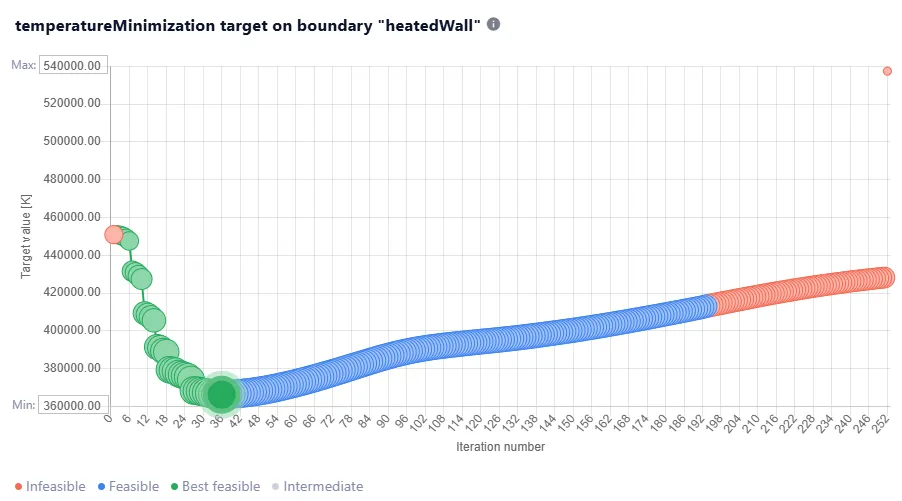
Constraint Graph with the intermediate iteration
To distinguish intermediate datapoints, refer to the Download Design tab. For intermediate iterations, the geometry is not available in any CAD format, and as a result, the user will not have the option to download the geometry. However, for iterations where data is available, various geometry download options will be provided.
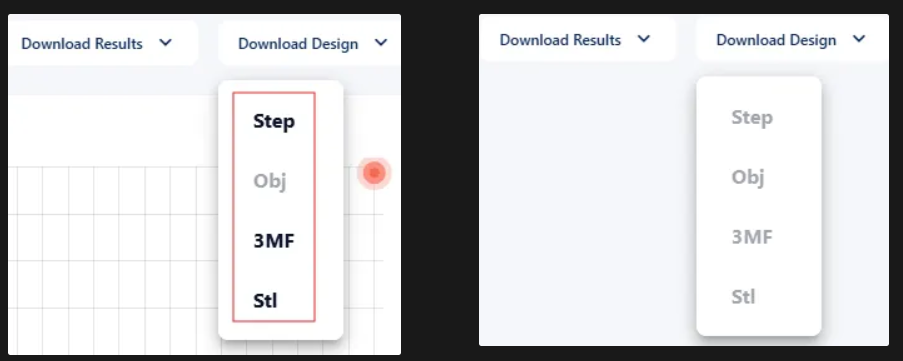
Inactive design download options for intermediate iteration
3D Results
Each intermediate iteration includes additional data to help users visualize the progression of the design. This data is represented through gradients on the objectives and constraints, offering a clear view of the design's evolution.
The image below illustrates the gradients applied to the targets. By examining these gradients, users can assess the current state and progression of the design.
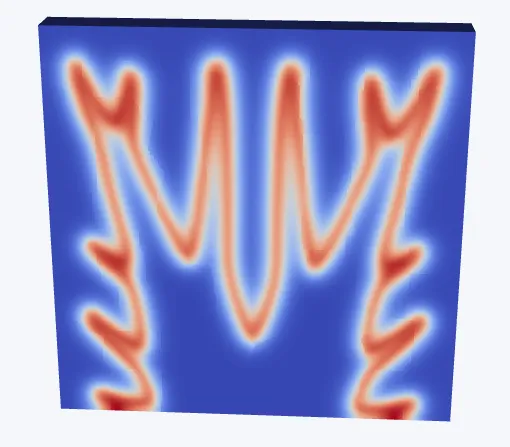
3D visualization of a gradient of a constraint
Through the dropdown menu, users can access gradients for various objectives and constraints, as shown in the example below.
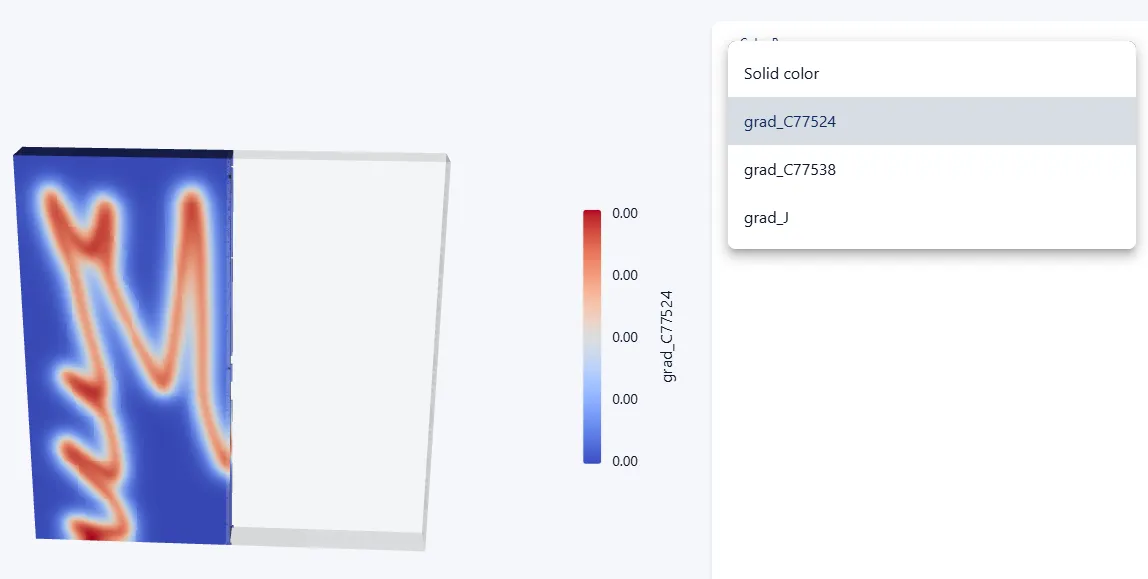
3D visualization of gradients of objective and constraint
Selecting specific iterations
The dots on the graphs are interactive. You can click on one to view it in more detail. Alternatively, you can directly insert an iteration number at the input field on the top if you would like to view that iteration in more detail, or you can use the arrows to navigate through the different iterations. The selected iteration in question will be highlighted in each of the graphs by fat circular markers.
For cases of type 'Standard design', once an iteration is selected, a GUI appears for each design subregion displaying the heatsink(s) ColdStream used during this iteration. Additional information about the displayed heatsinks will also be shown:
- What type of heat sink was attempted in the selected iteration: pins, fins, ...
- How the heat sink is manufactured and what material is used
- The number of elements
- Further geometrical information
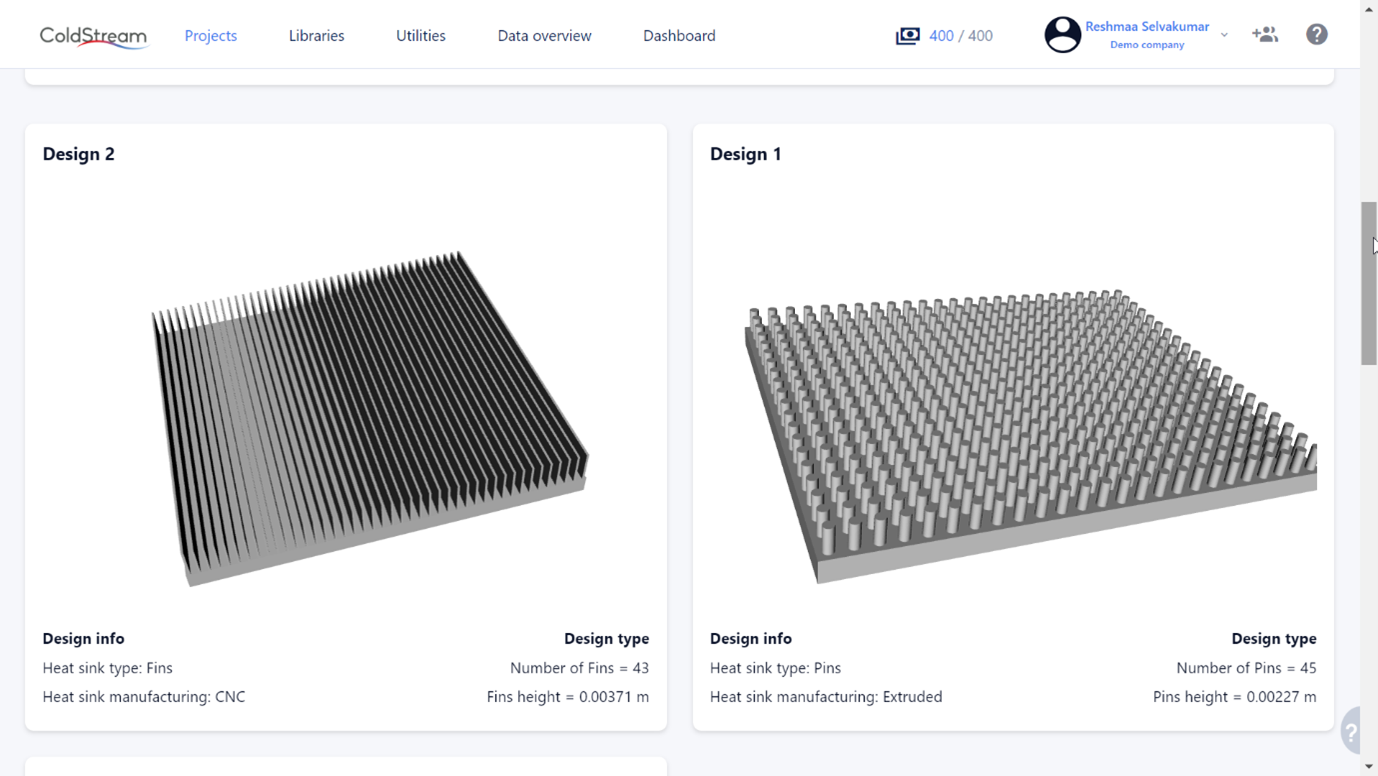
Heatsink GUI for selected iteration
Updated 8 months ago