
Manager dashboard
Introduction
The Manager Dashboard provides Administrator users with a centralized, high-level overview of key performance metrics for the company account. This built-in reporting eliminates the need for manual tracking and spreadsheets, offering immediate insights into team productivity, project statuses, and resource consumption.
Dashboard Tiles
The primary dashboard tiles summarize recent platform activity and overall work efficiency. This includes tracking the total number of unique designs generated and highlighting the average time the team spent configuring and analyzing each design.
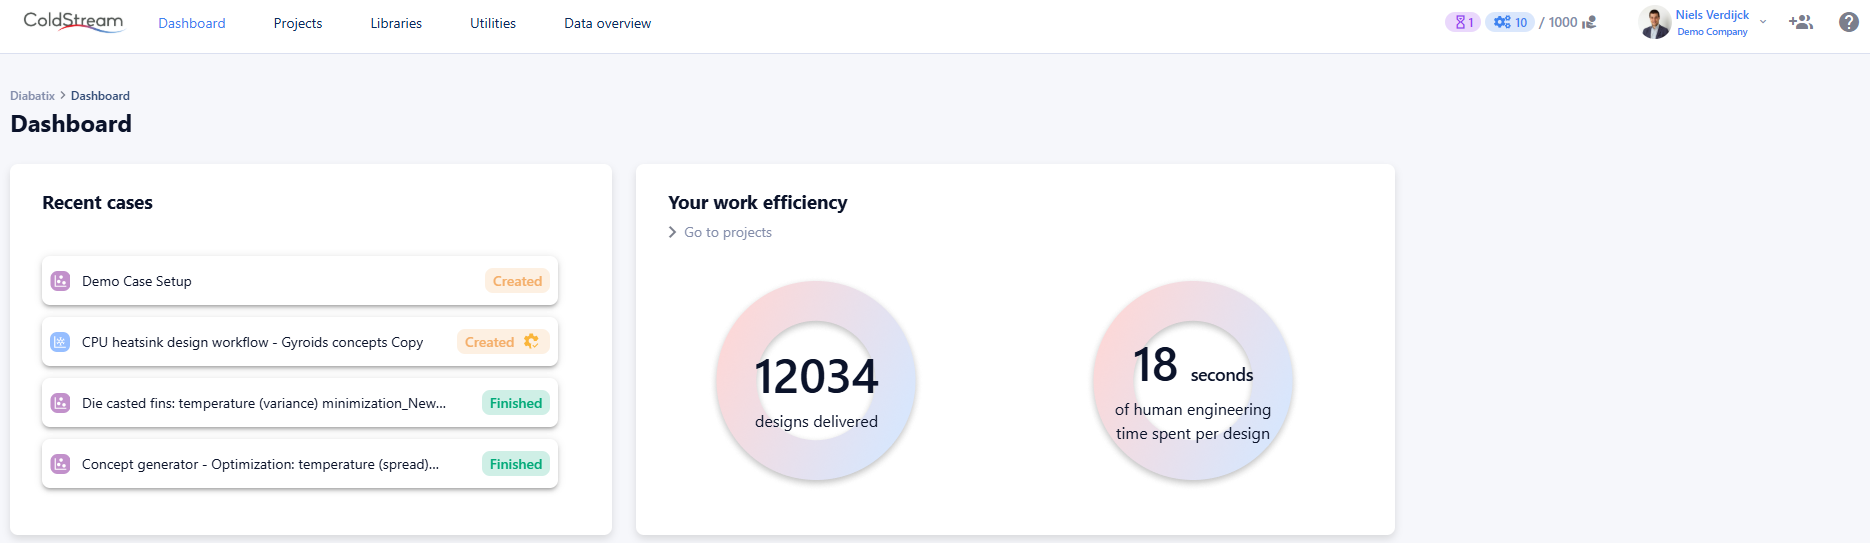
Dashboard tiles visualization
Status Tracking
The status board visualizes the current progress of all active work within the company account. By explicitly dividing progress into project-level and case-level statuses, administrators can efficiently manage overall workflows and follow up on specific generative or simulation tasks.
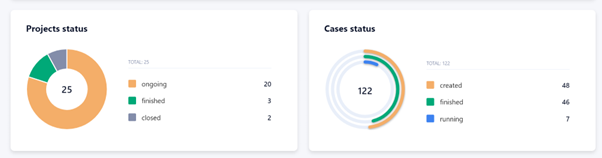
Status tracking visualization
Credit Statistics
This section provides comprehensive tracking of the company's computing credits. Administrators can monitor credit consumption over customizable timeframes, ranging from granular hourly usage to long-term annual trends.
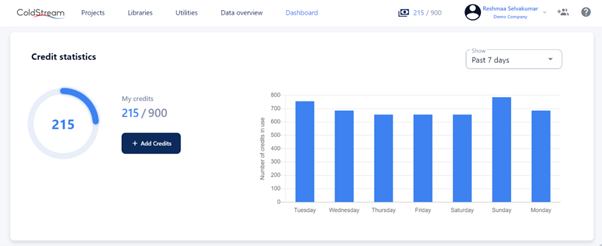
Credit statistics visualisaztion
Additionally, new credits can be requested directly through this interface:
- Select the required number of credits.
- Define the desired duration for the credits (ranging from 1 to 12 months).
- Review the automatically calculated cost for the selected time frame.
- Submit the request, which is instantly forwarded to your account manager for processing.
Activity History
Beyond high-level summaries, the dashboard offers detailed tracking of user activity across the company account through two distinct tabs:
- Global Cases: Displays a log of the most recent modifications, submissions, and status changes strictly at the case level.
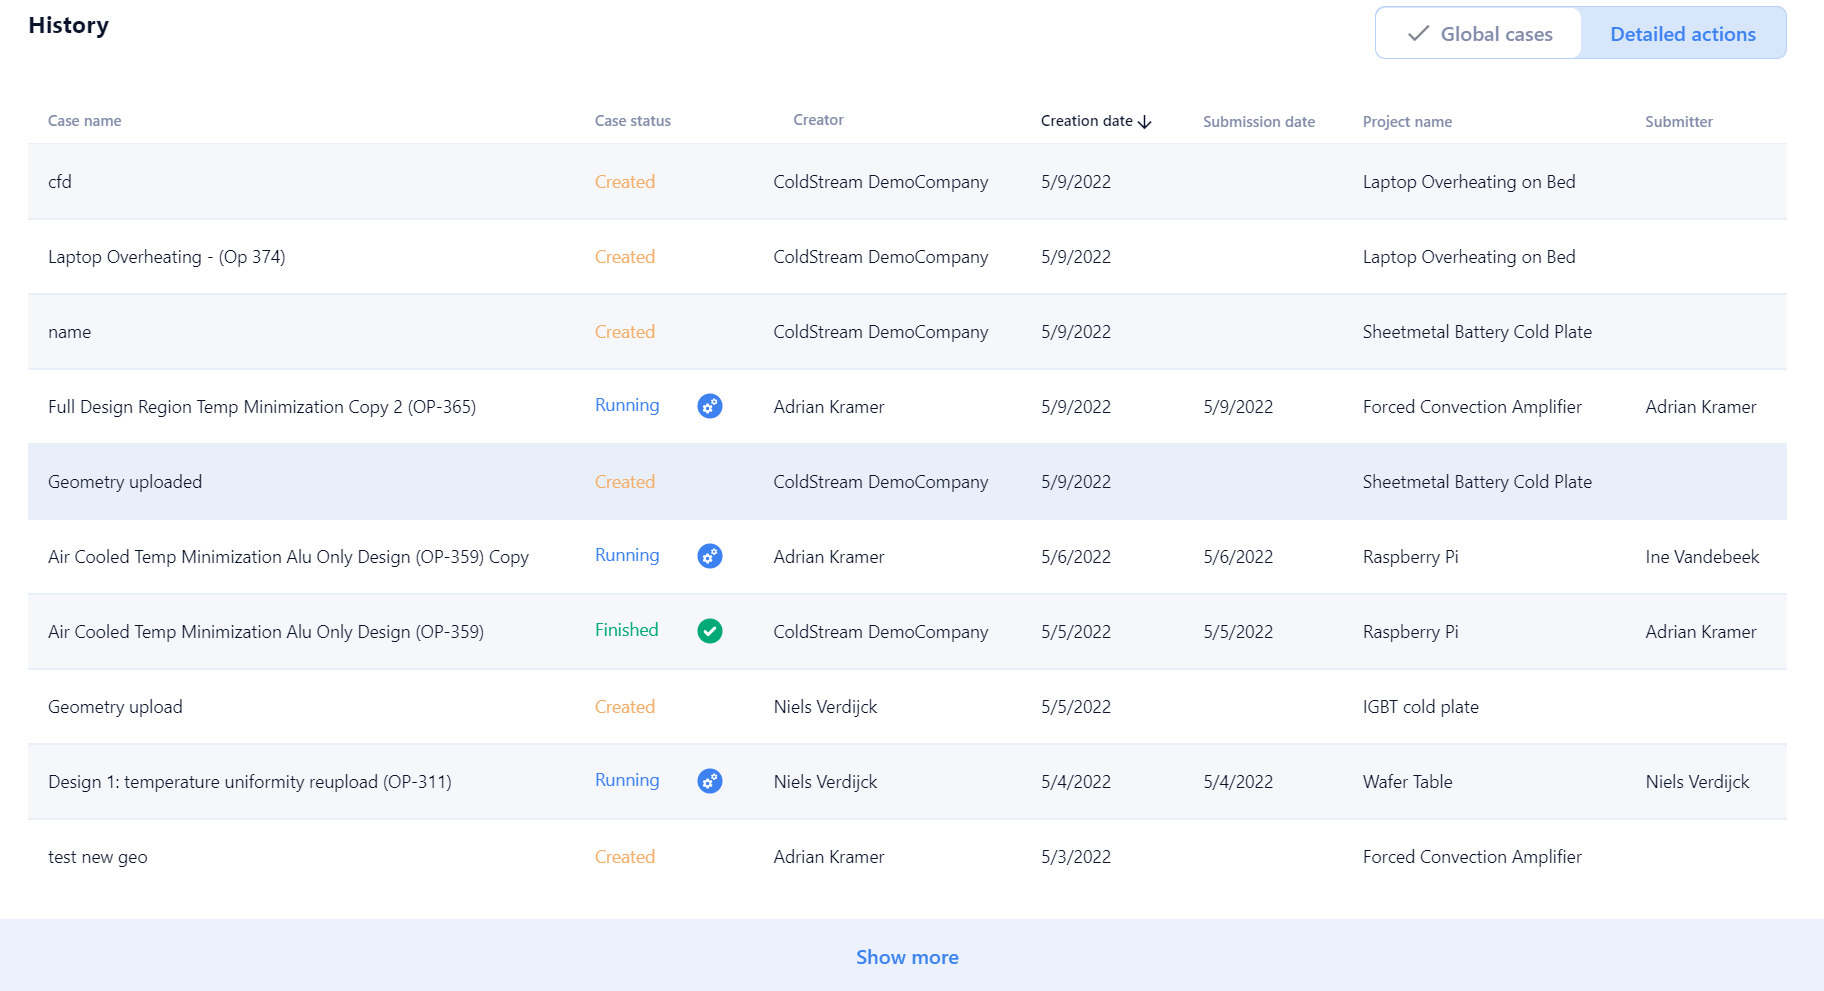
Global activity history visualization
- Detailed Actions: Provides a chronological audit trail of all actions performed by every user within the company account. This granular tracking is also available within individual cases to identify exactly who made specific configuration changes.
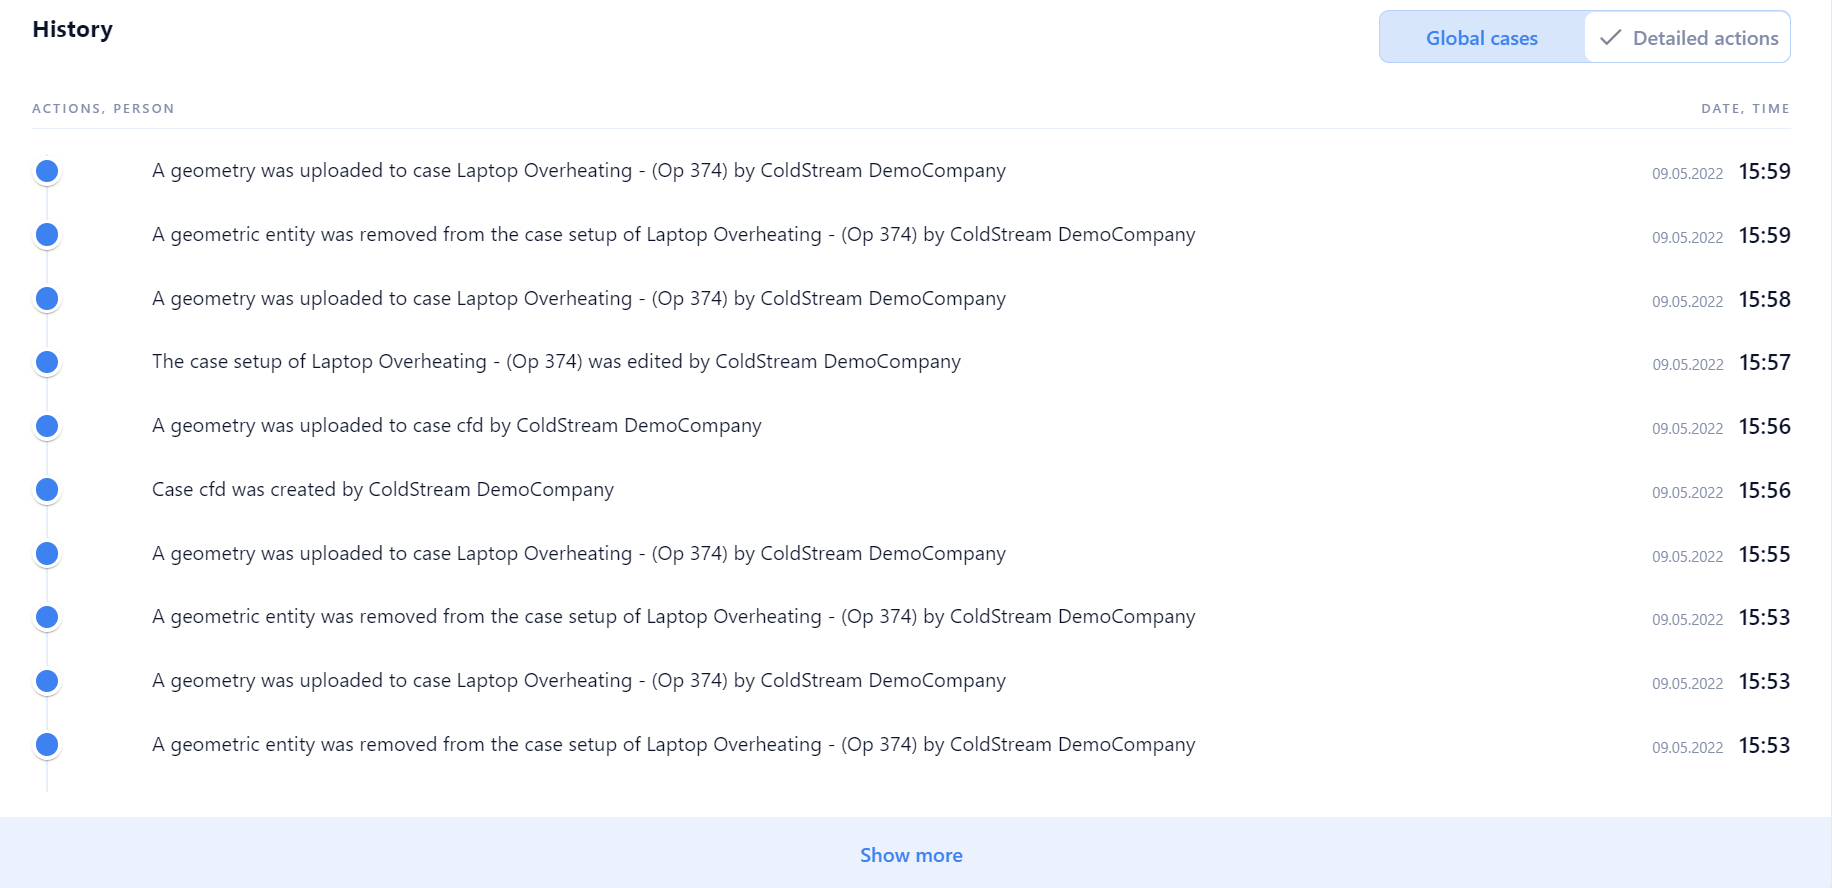
Detailed actions activity history visualization
Updated 27 days ago